Reporting and Board Export
Kanera reporting stays connected to the work. Use Work Done Report for a period review with current workload and risks. Export a whole board to Excel or JSON for backup, migration, or offline review. Use Table export when you need a filtered report shaped by the current columns, grouping, sorting, aggregates, or breakdown.
Dependencies and related-card relationships are not included in board exports and are not recreated by copying cards. Use the relationship API when an integration needs to read them.
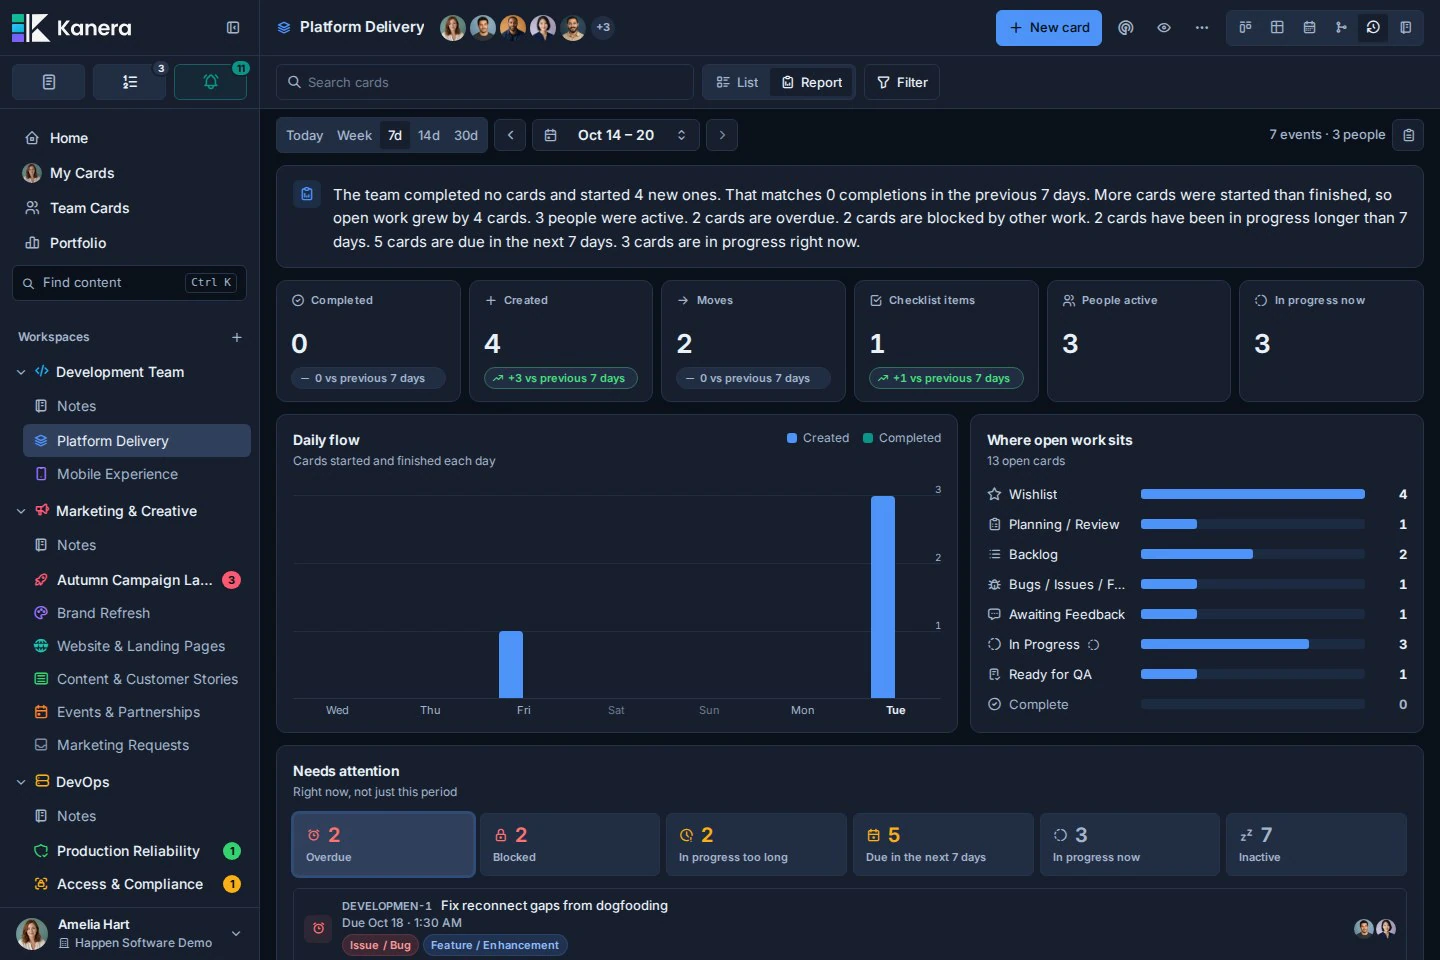
Work Done report
Open Work done on a board, in My Cards, or in Team Cards, then choose the Report layout. Use it for a weekly review, standup, or client update; switch back to List for the dated activity stream.
The report brings together:
- A plain-language summary and key counts, with changes against the previous period when a comparison is available.
- Daily flow showing cards created and completed each day.
- Where open work sits, grouped by workflow list.
- Needs attention, with current risks and the cards behind them. Select a category, then open a named card to act on it.
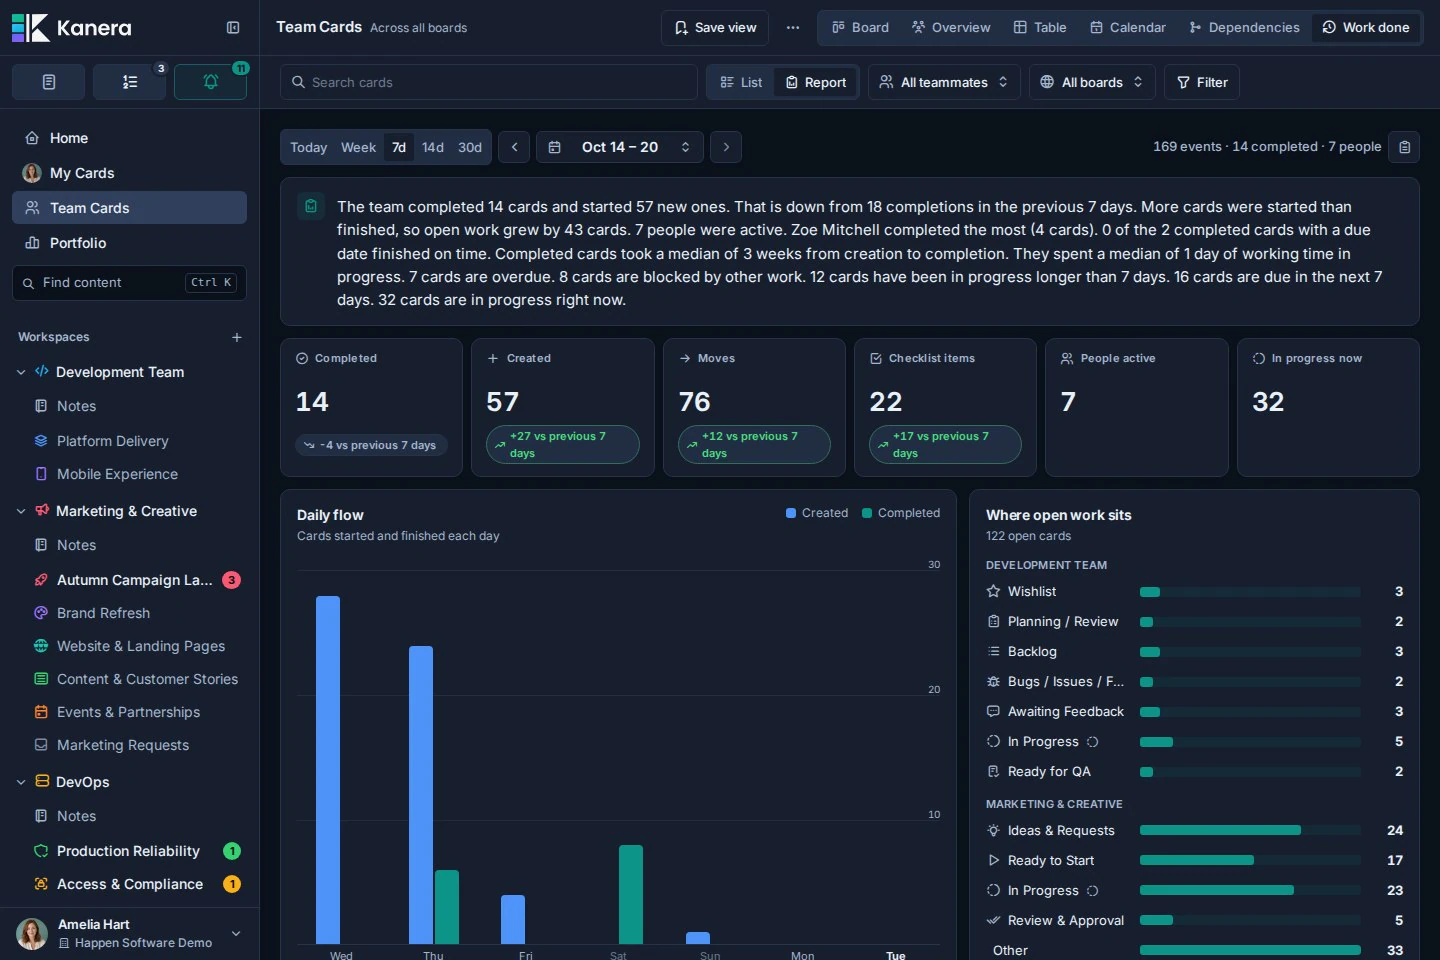
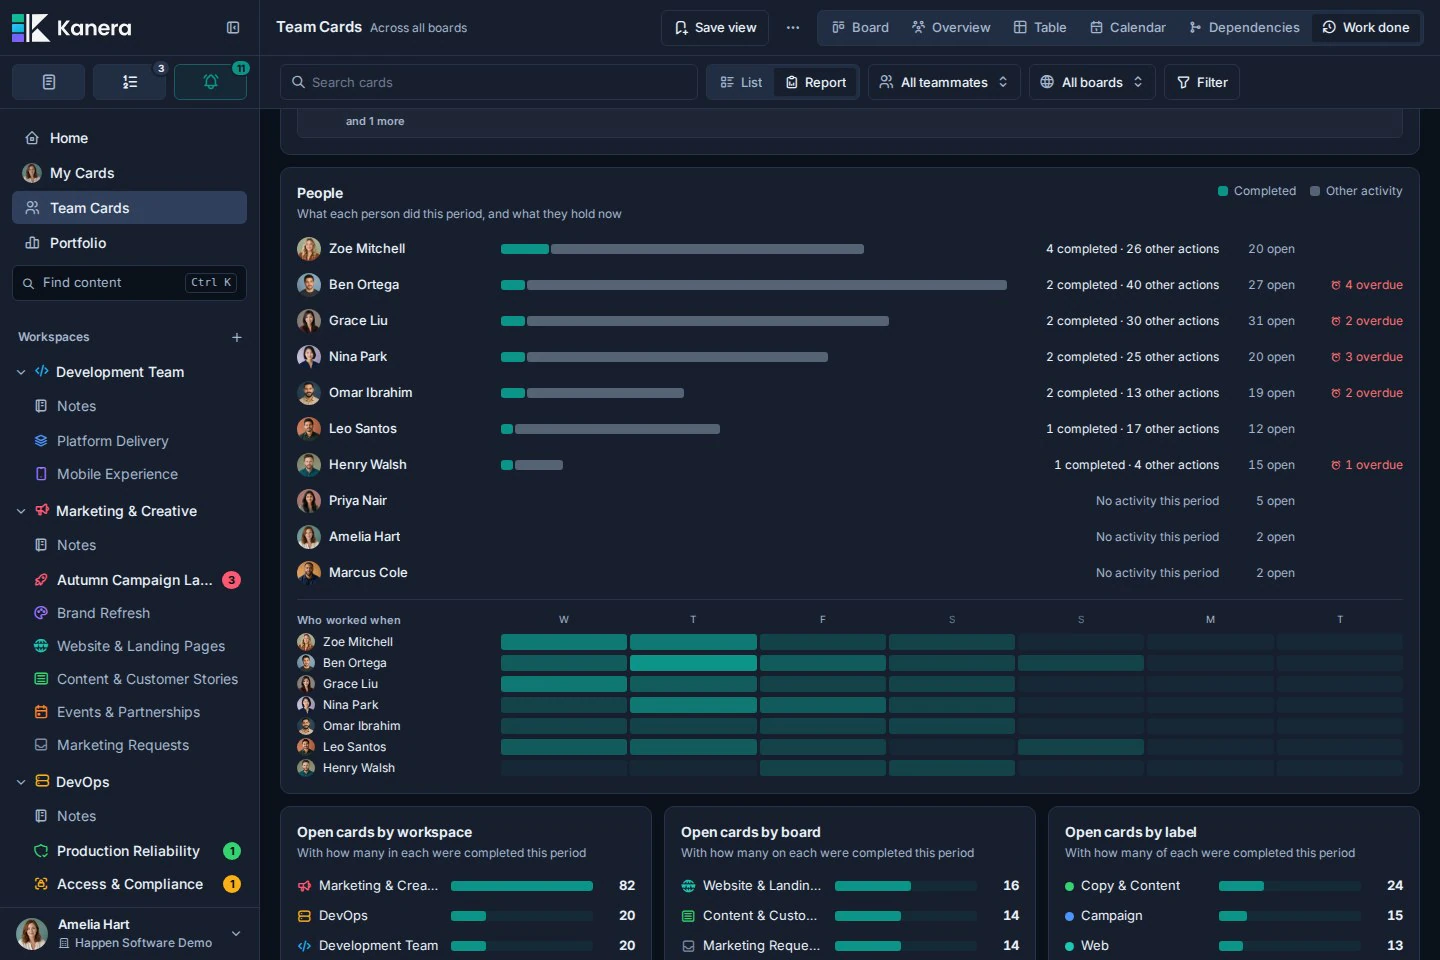
- People, comparing activity during the period with each person's current open and overdue work, plus a daily activity heatmap.
- Breakdowns by workspace, board, label, select field, and checklist when the scope has relevant data.
Sections appear only when there is something to show. Period activity describes what happened in the selected dates; open work and attention counts describe right now, so they are not historical snapshots.
Choose the scope and period
A board report covers that board. My Cards follows your personal scope; Team Cards covers the team or the selected teammate. Existing scope and filters narrow the report. Cross-board reports can add board and workspace breakdowns.
Report opens on Week (Monday to today); List opens on 7d. Each layout remembers its own period. Choose a preset or a custom range within the last 60 days, and use the arrows to review another period. Previous-period comparisons disappear when the comparison falls outside the available history.
Use Copy period as text to copy the report for a written update. This is separate from the Table and board exports below.
Choose the right export
| Need | Export | Result |
|---|---|---|
| Back up, migrate, or review one complete board | Export board from the board toolbar | The entire board data visible to you, as Excel or a structured Kanera JSON archive. |
| Export a filtered or grouped report | Export this table from Table | The current Table result as Excel or JSON. |
To export a whole board, open it in Board view, select the download button labelled Export board, and choose Excel or JSON. Editors and admins can export; assigned-items-only Editors receive only data they are allowed to see. See Boards for the contents of each format and how to import a Kanera JSON archive.
Choose the reporting surface
| Question | Best surface |
|---|---|
| What fields and values are on these cards? | Table |
| How do numeric values total by client, owner, stage, or another dimension? | Table aggregates and breakdowns |
| Which organisations, workspaces, or boards are late or overloaded? | Portfolio |
| Which cards make up a Portfolio metric? | Portfolio Table drill-down |
| What moved or finished on a day? | Work Done |
| What is one person or the team carrying? | My Cards or Team Cards |
| What needs my attention this week? | Home |
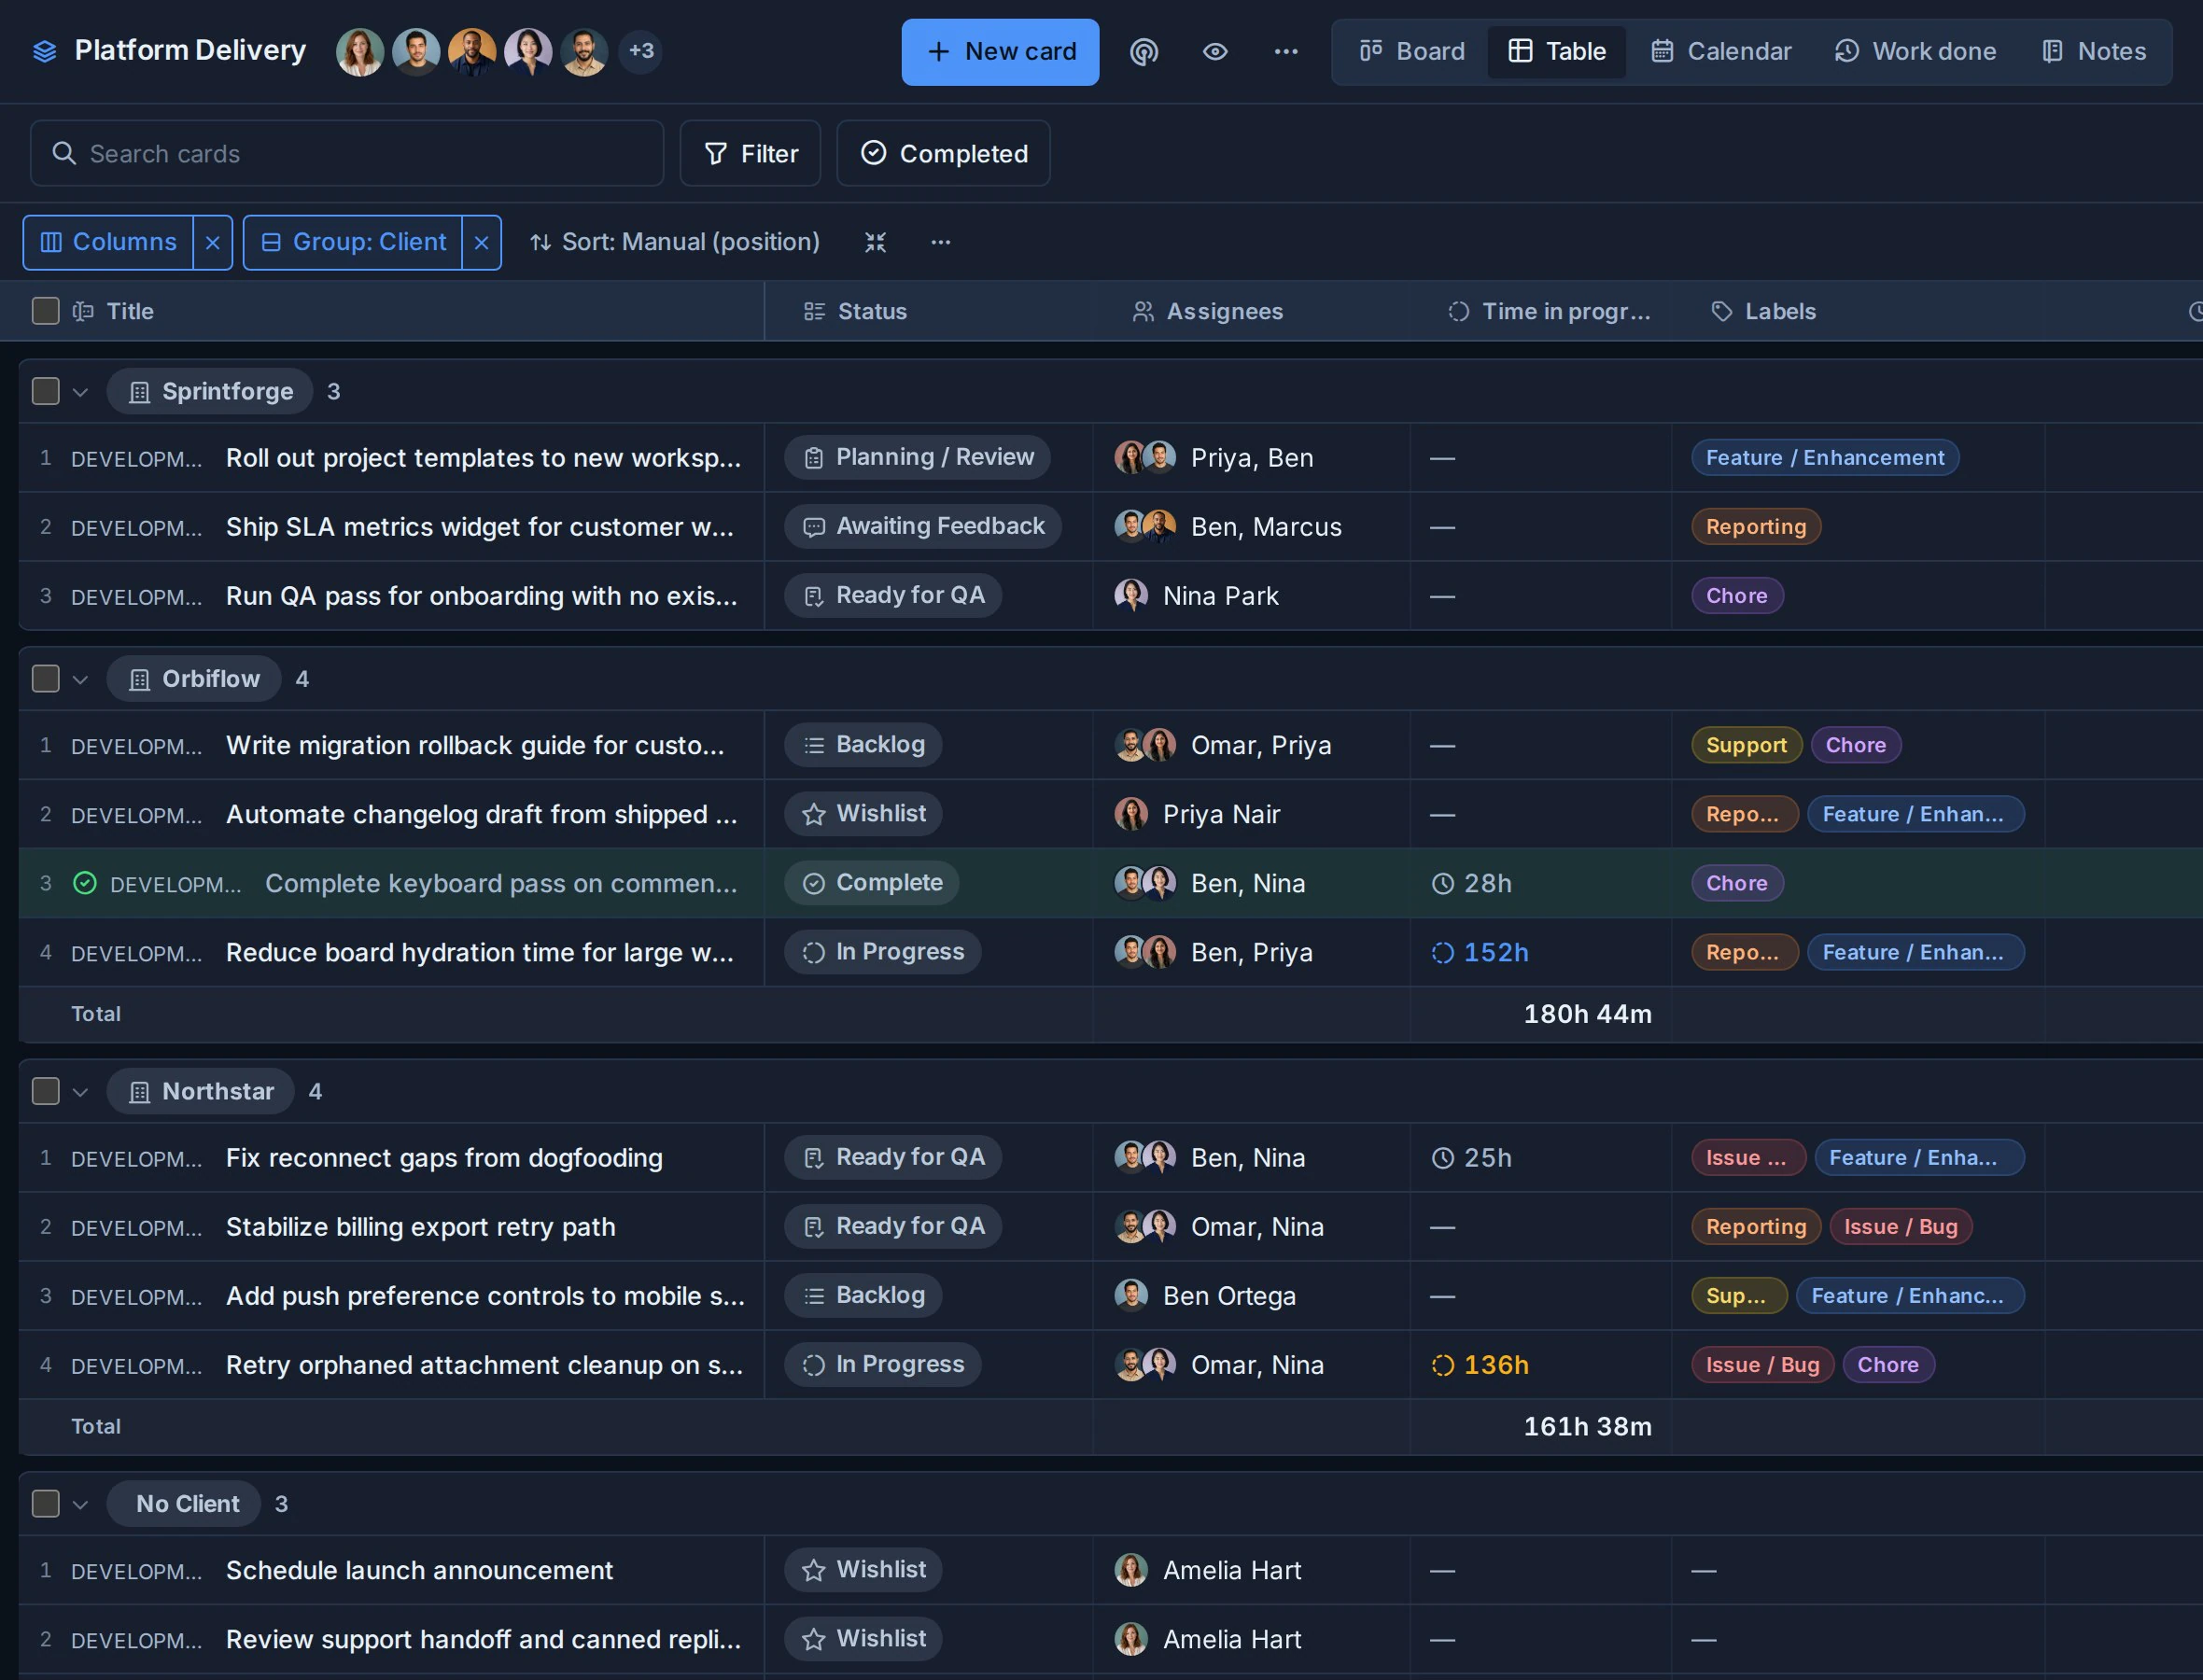
Build a Table report
- Open a board, My Cards, Team Cards, or a Portfolio metric drill-down.
- Switch to Table.
- Set the board scope when using Global Work.
- Use search and filters to narrow the cards.
- Choose the columns to include.
- Group by the main reporting dimension.
- Choose the sort order.
- Add Sum or Avg aggregates for numeric custom fields.
- Add a second Break down by dimension when needed.
- Export to Excel or JSON.
For a report you will revisit, save the Global Work view. Saved views preserve the lens, source scope, filters, display, grouping, sorting, and Table presentation.
Filters
Available filters can include:
- Search text.
- Organisation, workspace, or board scope.
- Labels.
- Assignees.
- Workflow lists.
- Due-date conditions and overdue status.
- Completion-date range.
- Archived state.
- Supported custom field conditions.
- Unassigned cards in Portfolio.
Filters run before grouping, aggregates, Portfolio metrics, and export. A saved view lets a team return to the same reporting definition without rebuilding it.
Grouping and columns
Common grouping choices include:
| Group by | Useful for |
|---|---|
| Organisation, workspace, or board | Source and portfolio analysis. |
| List | Work by workflow stage. |
| Assignee | Ownership and workload reports. |
| Label | Work by category, priority, or service. |
| Due date | Deadline and ageing reviews. |
| Completion | Open-versus-completed summaries. |
| Custom field | Client, department, risk, work type, target release, or another structured dimension. |
Columns define the detail on each card row. Use the Columns menu to show built-in and custom fields, then reorder or resize them.
Aggregates
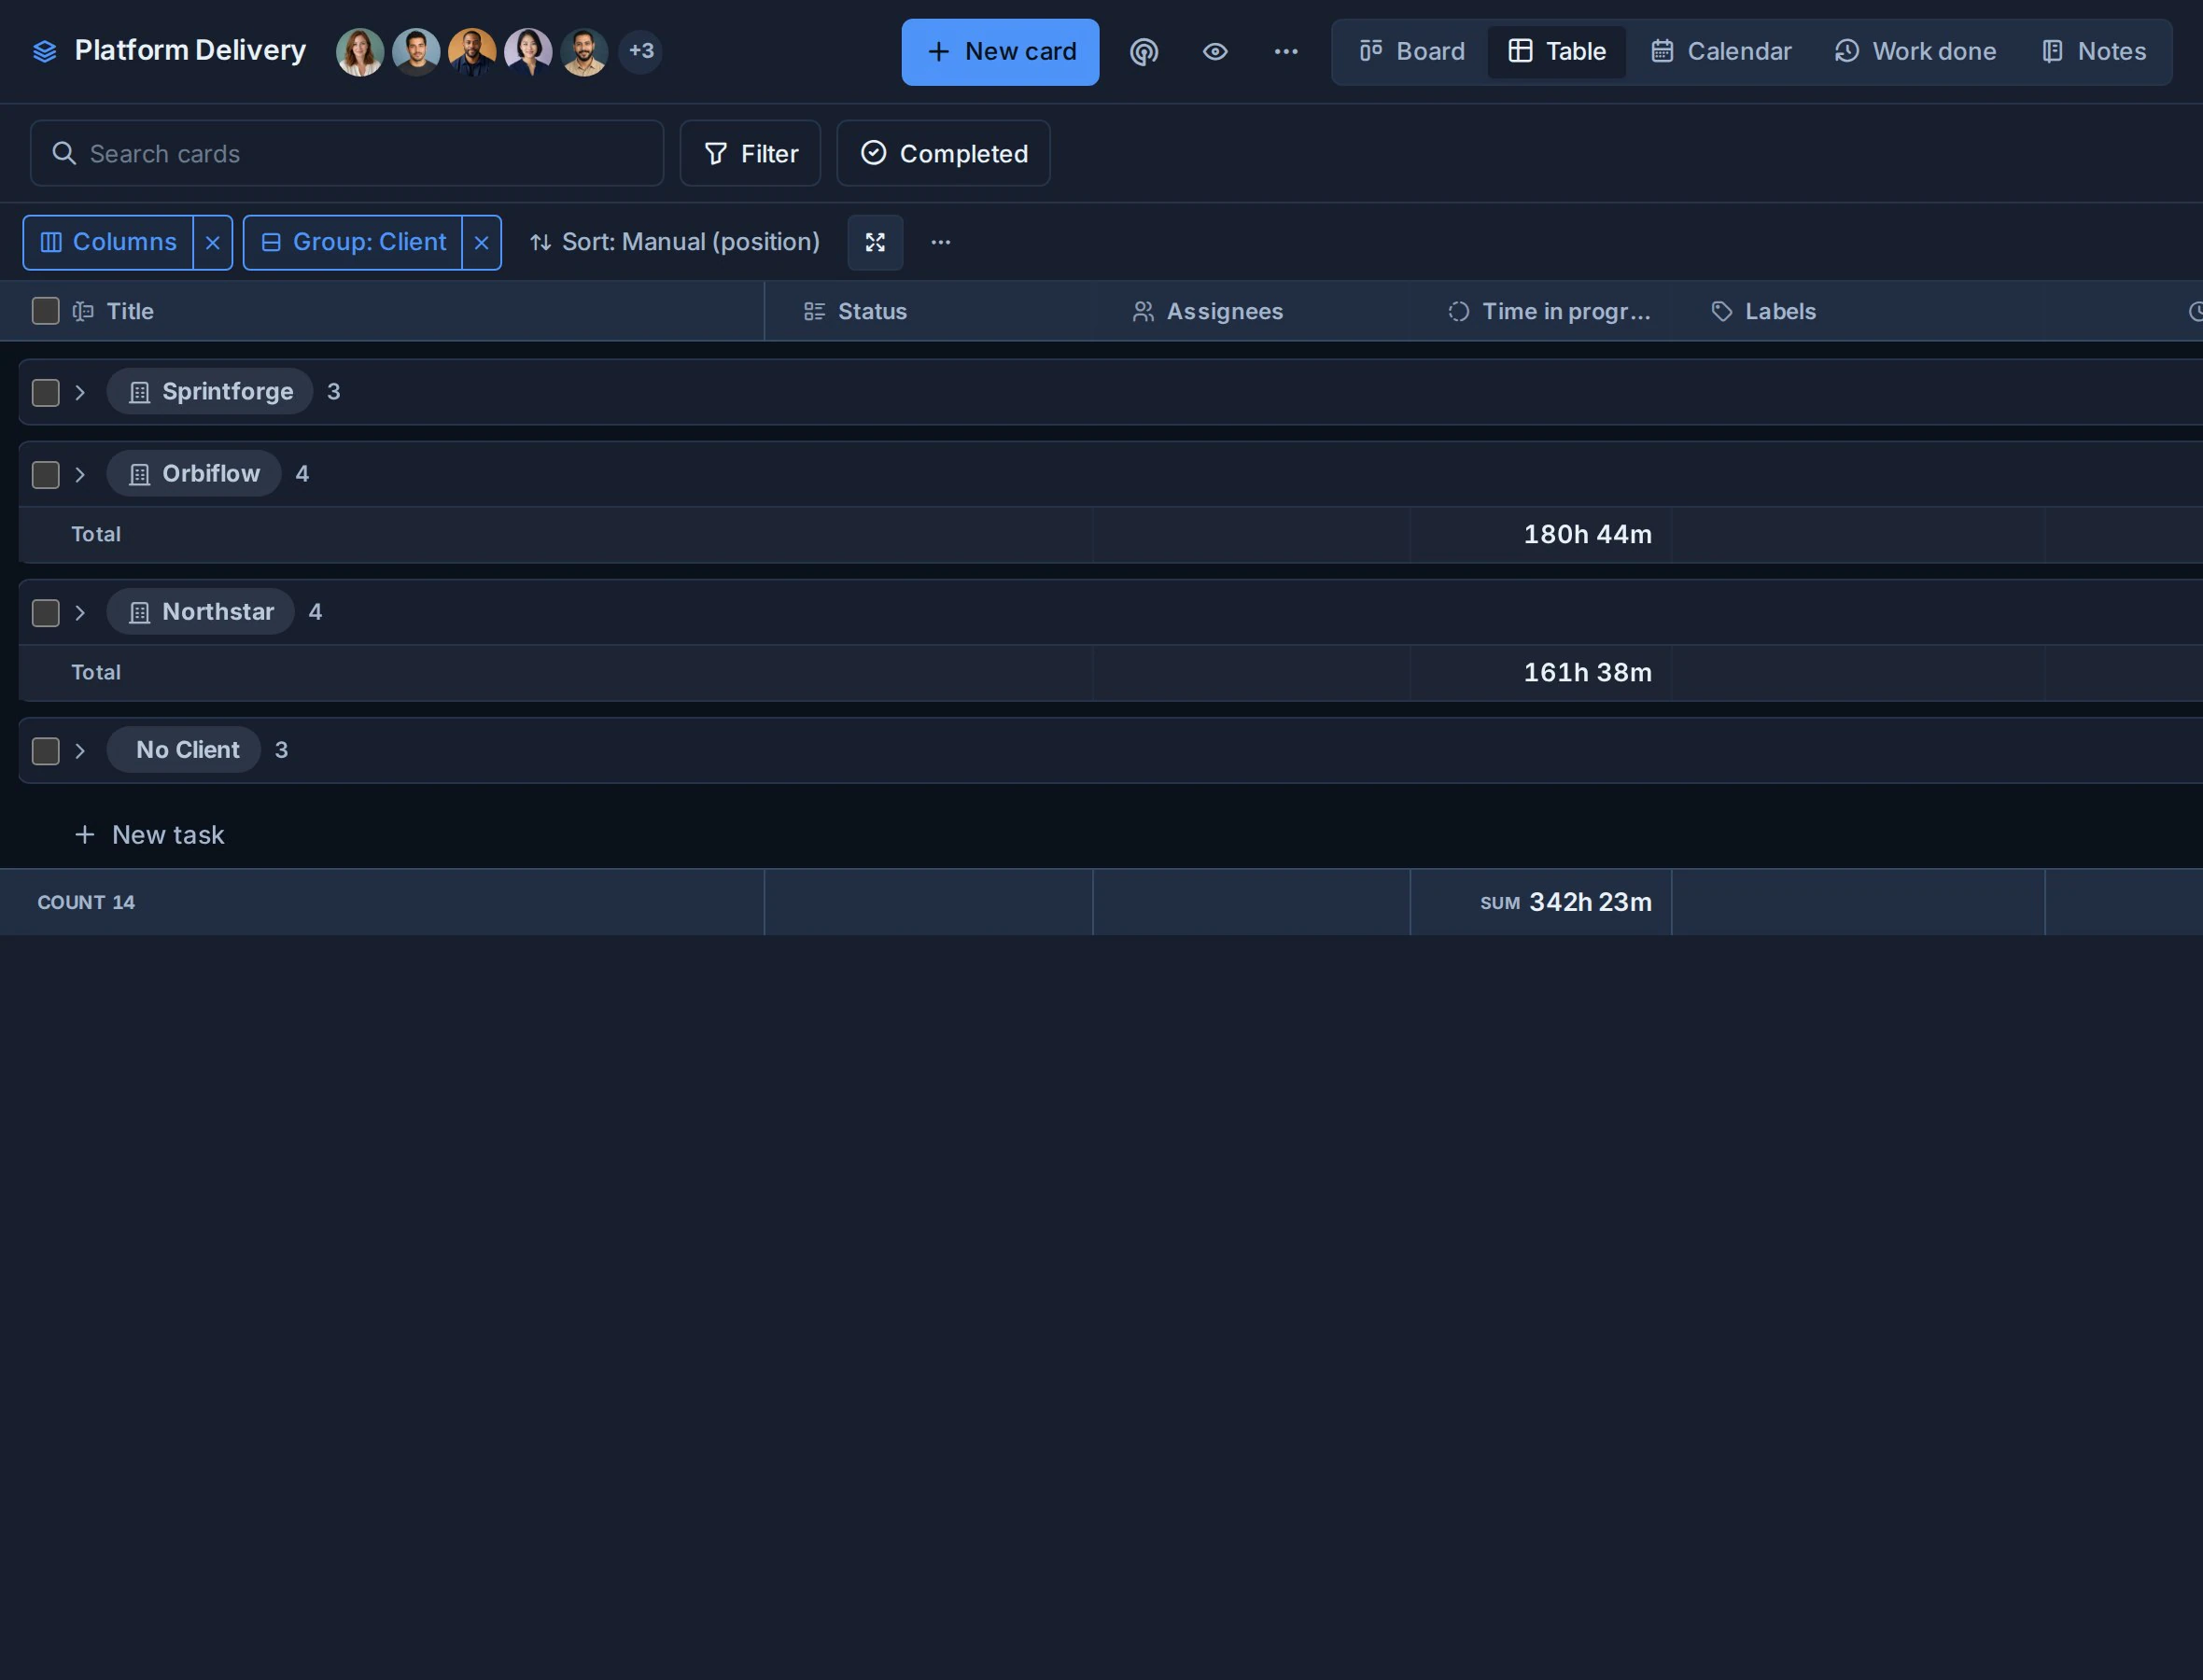
Aggregates summarize numeric custom fields inside each group:
- Sum for hours, budget, points, cost, quantity, or revenue.
- Avg for score, risk, confidence, complexity, or estimates.
The Time in progress column summarizes the same way, so a group's Sum is the working hours its cards have spent in In progress lists.
Shared workspace fields make cross-board aggregates consistent. A field such as Hours or Effort has the same definition on every board in that workspace.
Break down by
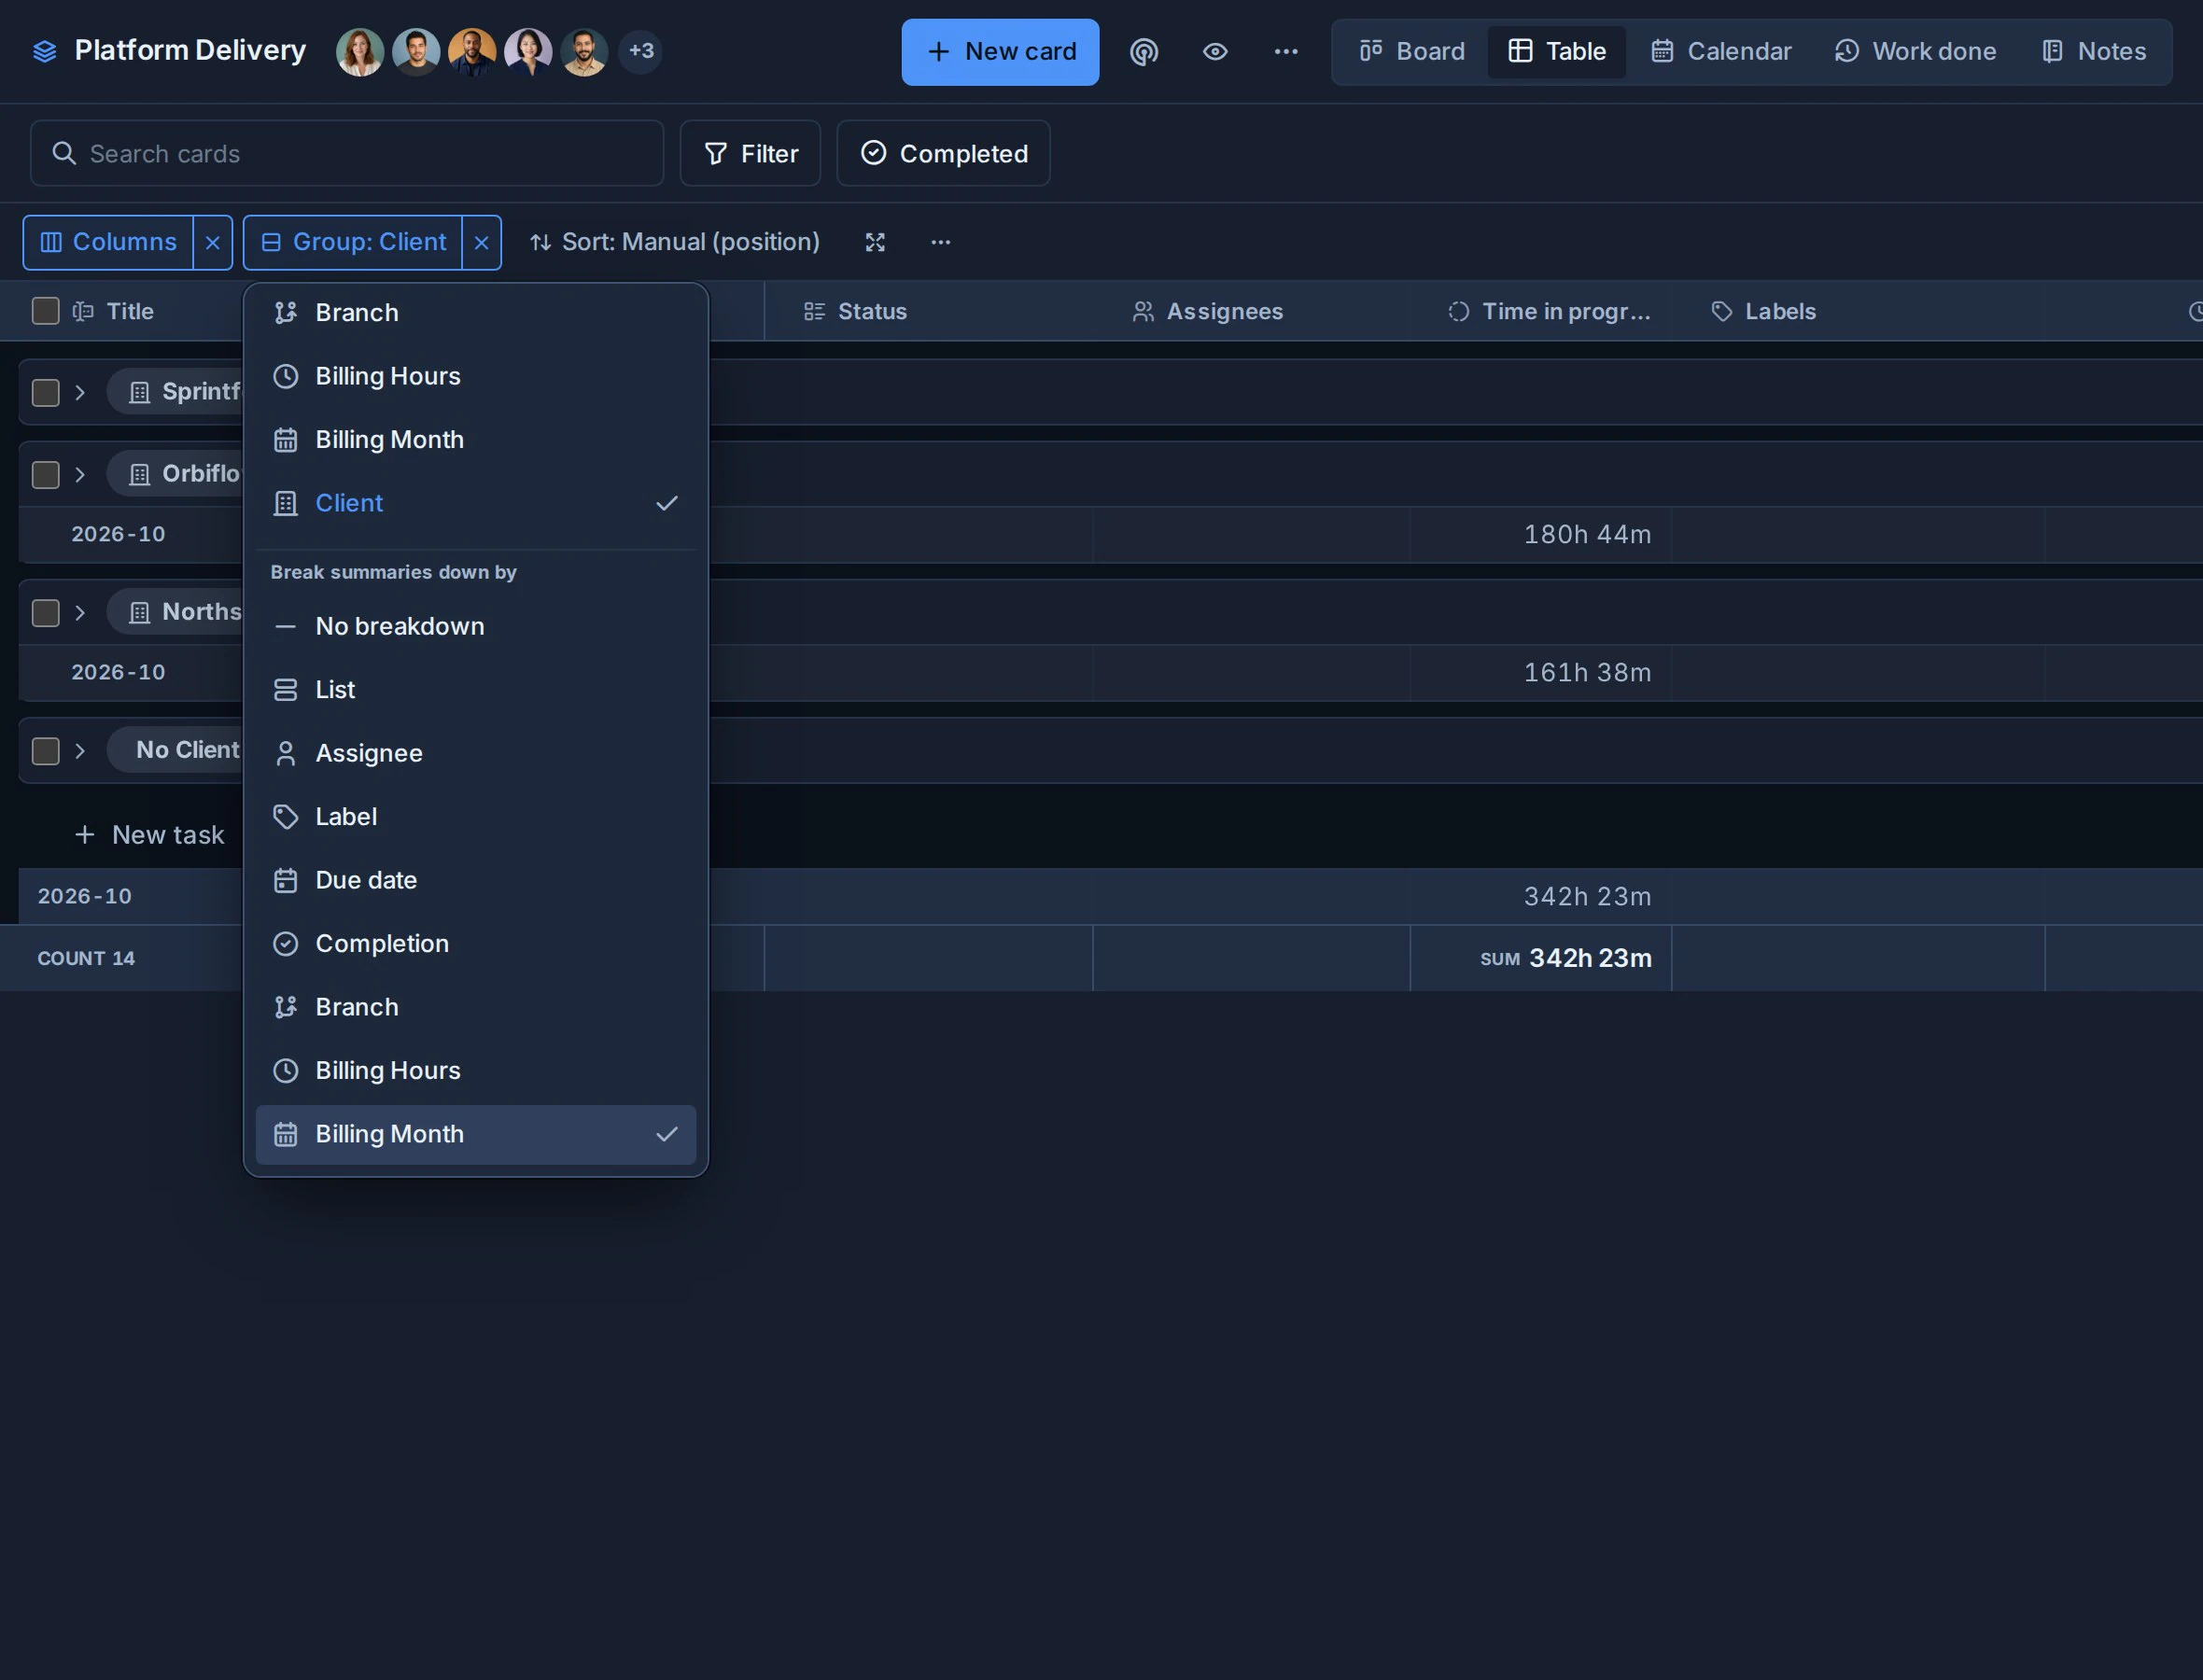
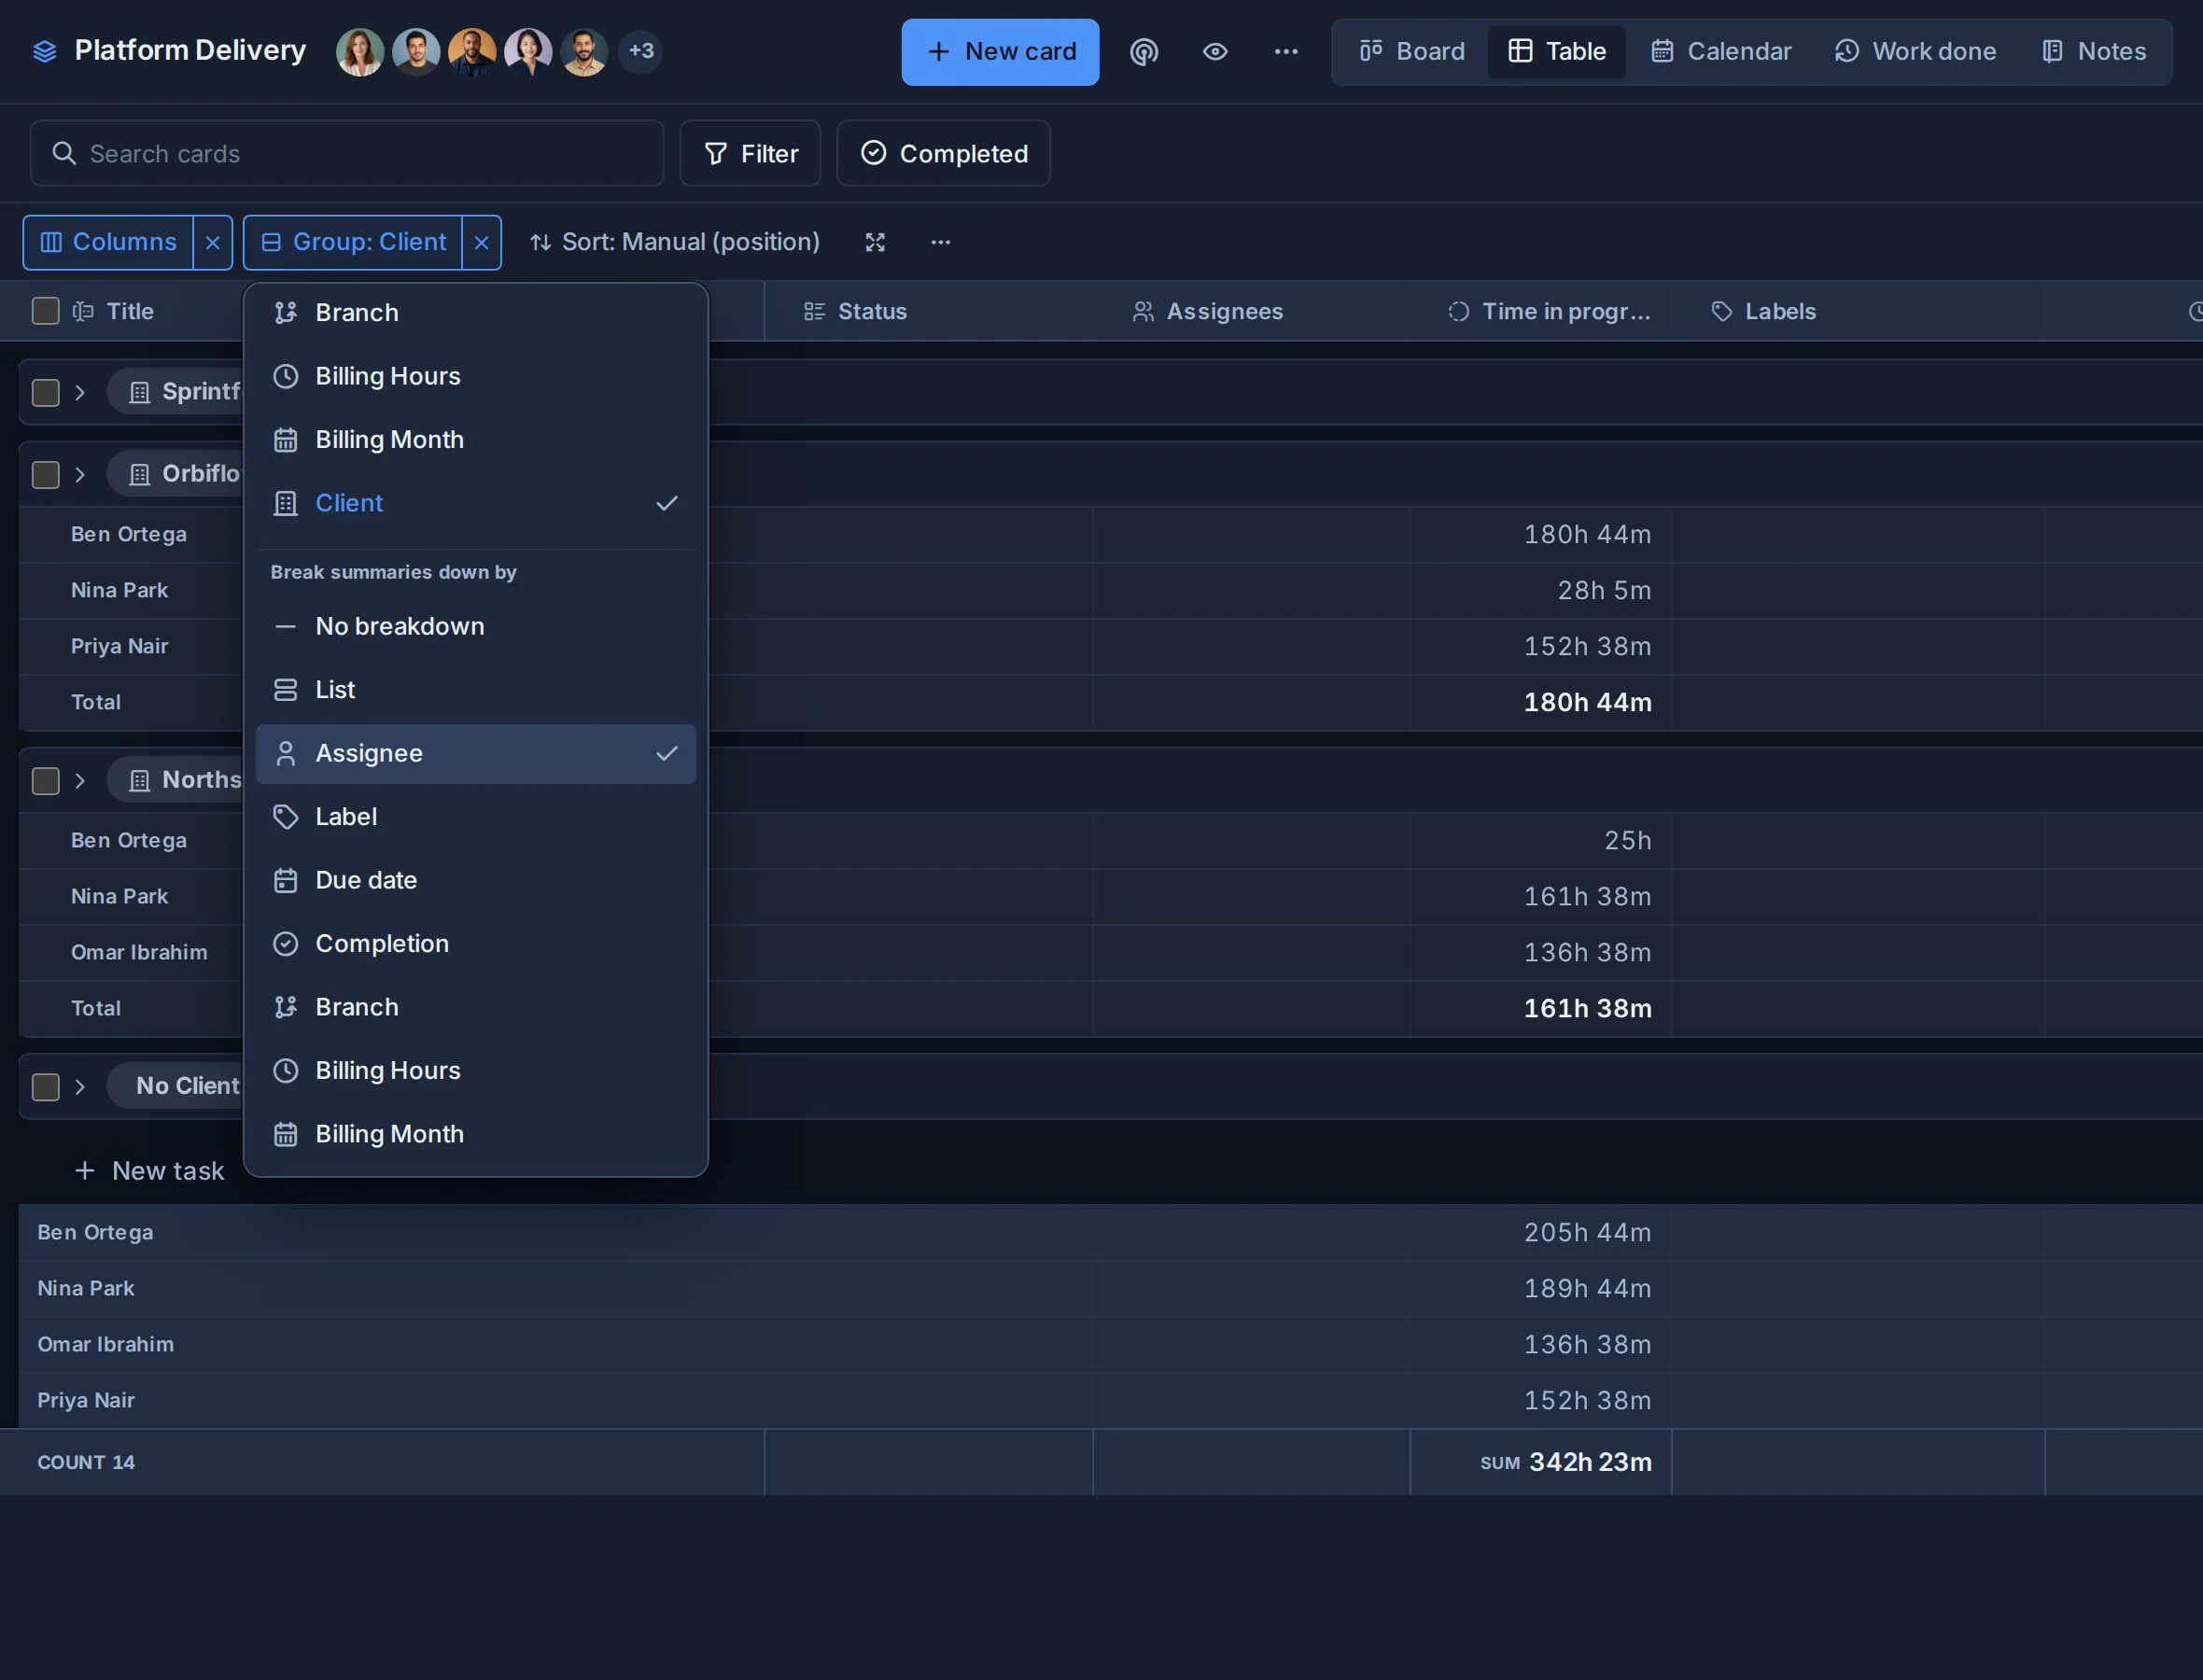
Break down by splits each group's numeric result by a second dimension.
| Group | Break down by | Question |
|---|---|---|
| Client | Work Type | How many hours went to each kind of work for each client? |
| Assignee | Priority | How much effort is each person carrying by priority? |
| List | Risk | How much high-risk work is in each workflow stage? |
| Due date | Board | Which boards are driving work due soon? |
| Label | Assignee | Who owns each service category? |
Multi-value fields can place a card into more than one matching bucket. This is deliberate: the breakdown shows every category the card contributes to.
Portfolio reporting
Portfolio summarizes the current Global Work scope with:
- Active cards.
- Overdue cards.
- Blocked cards, and cards at risk because a blocker is overdue or due after them. See Card Relationships and Blocking.
- Cards due in the next seven days.
- Unassigned cards.
- Inactive cards, using each workspace's inactivity window.
- Cards in progress, and cards in progress too long. See Time in Progress.
- Completed cards in the chosen reporting period.
- Overdue assigned checklist items.
The hierarchy compares organisations, workspaces, standalone-board groups, and boards. Select any metric to open its cards in Table.
Portfolio also includes 60 days of movement and delivery activity. The activity and metric counts use the same filter set, so a client, label, assignee, or custom-field filter changes both.
Use Portfolio when you need the rollup first. Use Table when you need card detail or calculations.
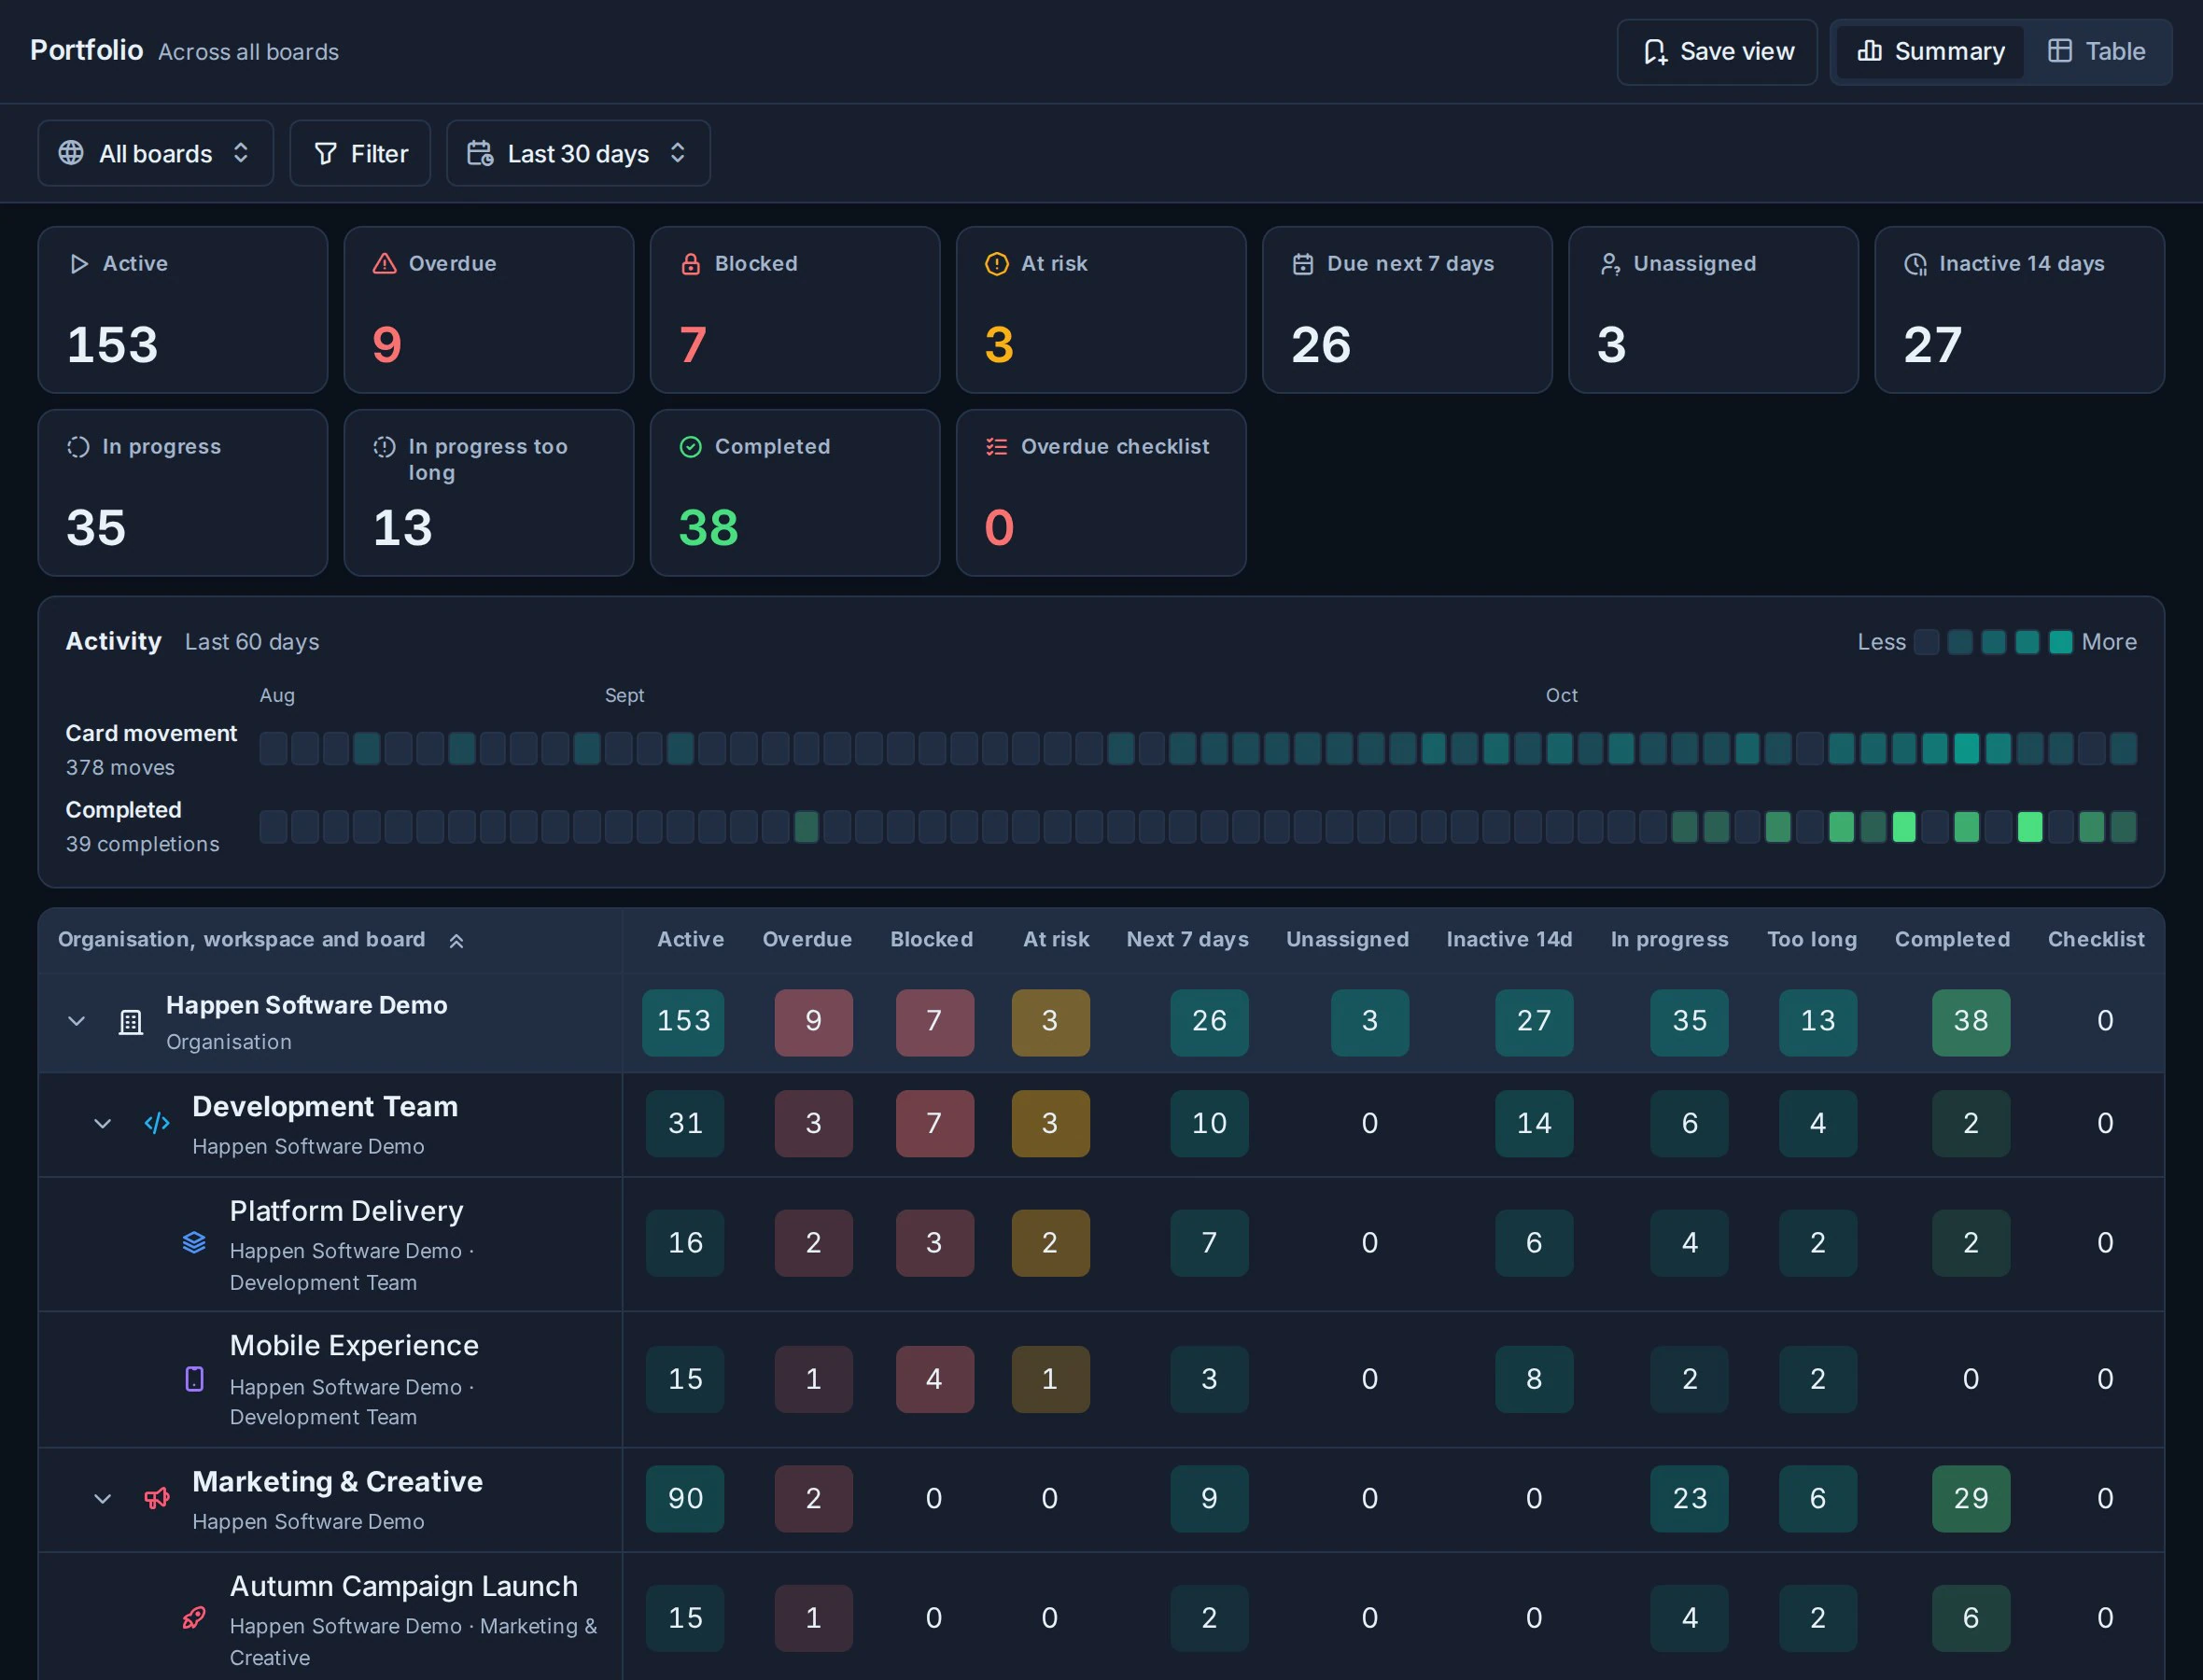
Table Excel workbook
Table exports an .xlsx workbook.
| Sheet | What it contains |
|---|---|
| Cards | The filtered card rows, selected columns, grouping, and card links. |
| Summary | Tidy numeric aggregate rows for filtering, formulas, and PivotTables. |
| Report | A readable grouped report when aggregates are enabled. |
Without aggregates, the workbook can contain only the Cards sheet.
Each exported card row includes its human-readable Key and a clean card-detail link. These are more useful for reviews and cross-system references than Kanera's internal card id.
The Summary sheet keeps values numeric for PivotTables, AutoFilter, SUMIFS, AVERAGEIFS, and downstream templates. The Report sheet presents those values in a stakeholder-friendly layout.
Table JSON export
JSON export contains the same report definition and result in structured form:
- Export metadata.
- Source scope.
- Filters.
- Grouping and sorting.
- Selected columns.
- Groups and card rows.
- Aggregate and breakdown configuration.
- Summary rows when aggregates are enabled.
Use Table JSON for scripts, integrations, or another reporting pipeline. For a restorable archive of a complete board, use Export board -> JSON instead.
Completed work
Use Filter -> Completed to include cards from a chosen completion-date range in Table. They can be grouped, sorted, aggregated, and exported with active cards.
Use completed-card history when you need a focused archive of completed cards without mixing them into the main result.
Use Work Done List for activity on a specific day, or Report for a period summary alongside current workload and attention signals.
Example reports
- Monthly billing: filter completed cards by date, group by Client, sum Hours, and break down by Work Type.
- Team load: open Team Cards, group by Assignee, sum Effort, and break down by Priority.
- Portfolio risk: filter by a Risk field, compare overdue counts and cards due in the next seven days by board, then open a metric drill-down.
- Deadline pressure: group by Due date, sum Effort, and break down by Board.
- Delivery review: use Work Done Report for the period summary and current risks, then List for the day-level event detail.